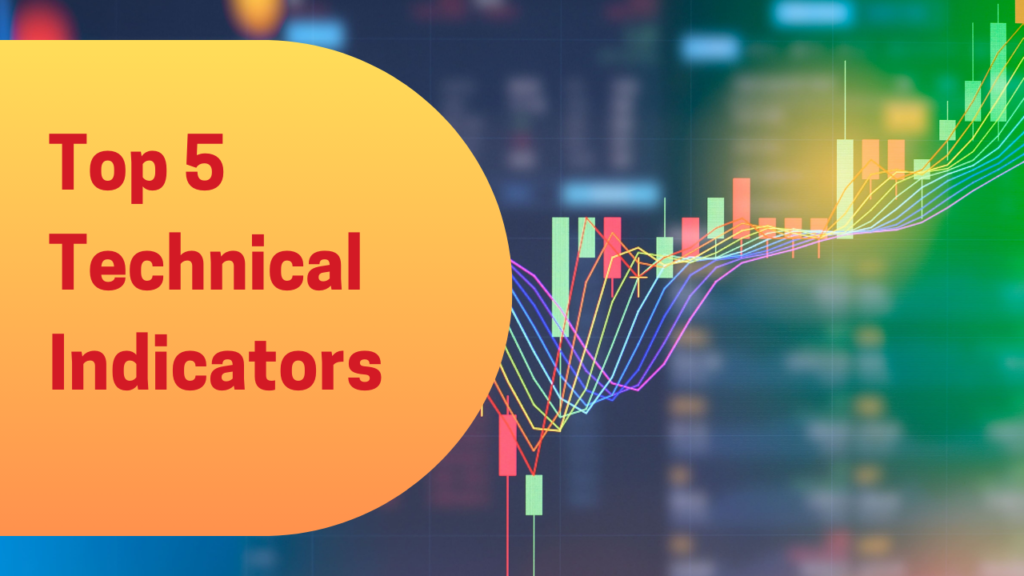
Introduction
Ever thought about how pros predict stock price changes? They don’t just guess—they use tools called technical indicators.
These indicators are like a trader’s go-to toolkit. They help spot trends, measure momentum, track volatility, and find good times to buy or sell. Whether you’re just starting out or already have experience, knowing how these tools work can improve your trading decisions.
What is Technical Indicator ?
A technical indicator is a formula that uses a stock’s price, volume, or open interest. Traders rely on these tools to study past price movements and forecast future trends.There are various types of indicators, including:
* Trend indicators: Show the market’s overall direction.
* Momentum indicators: Measure how fast prices are moving.
* Volatility indicators: Display the amount of price change.
* Volume indicators: Track how many shares are being traded.
Here are 5 essential indicators every trader should know:
1️⃣ Supertrend Indicator: Clear Buy and Sell Signals
The Supertrend Indicator is simple to use and highly effective. It shows the market’s trend and provides straightforward buy or sell signals.
How It Works:
* It appears as a line on the price chart.
* Green Line → BUY Signal ✅
* Red Line → SELL Signal ❌
Why Use It:
* Ideal for intraday and swing trading.
* Filters out noise and false signals.
* Performs well in trending markets.
Pro Tip: Pair it with RSI for extra confirmation before making a trade.
2️⃣ Moving Averages (MA & EMA): Follow the Trend
The saying “The trend is your friend” sums up Moving Averages perfectly. These indicators help you spot the market’s direction, so you avoid trading against it.
Types of Moving Averages:
* Simple Moving Average (SMA): Averages prices over a set time (e.g., 50-day SMA).
* Exponential Moving Average (EMA): Focuses more on recent prices, giving faster signals.
Why Use It:
* Detects uptrends and downtrends. 📈📉
* Commonly used in Golden Cross and Death Cross strategies.
* Pairs well with MACD and RSI for confirming trends.
Pro Tip: EMA is great for short-term trading, while SMA works better for long-term strategies.
3️⃣ Relative Strength Index (RSI): Find Overbought and Oversold Zones
Ever bought a stock at its highest point only to watch it drop? RSI can help prevent that by showing whether a stock is overbought or oversold.
How It Works:
RSI ranges from 0 to 100.
Over 70: Overbought, price might drop 🔴
Under 30: Oversold, price could climb 🟢
Why Use It:
✔️ Helps time when to buy or sell
✔️ Great for momentum trading
✔️ Reduces the risk of buying too high or selling too low
Pro Tip: Pair RSI with Bollinger Bands to validate potential breakouts.
4️⃣ MACD (Moving Average Convergence Divergence): Spot Trend Reversals
What if you could identify trend changes early? That’s what MACD helps you do.
How It Works:
It uses two lines:
MACD Line: Fast-moving
Signal Line: Slow-moving
Signals to Watch:
Bullish: MACD crosses above the Signal Line ✅
Bearish: MACD crosses below the Signal Line ❌
Why Use It:
✔️ Detects trend reversals effectively
✔️ Works in any market condition
✔️ Useful for short-term and long-term strategies
Pro Tip: Combine MACD with volume analysis to confirm strong trends.
5️⃣ Bollinger Bands: Measure Volatility
Ever notice a stock trading in a tight range, then suddenly making a big move? Bollinger Bands help spot those opportunities.
How It Works:
Upper Band: Marks overbought levels 🔴
Lower Band: Highlights oversold levels 🟢
Middle Band (SMA): Shows the trend direction
Why Use It:
✔️ Identifies volatility and breakout zones
✔️ Works for both range-bound and trending markets
✔️ Perfect for swing and intraday traders
Pro Tip: When the bands tighten (squeeze), expect a significant price move soon. 💥
.